Solana Apps Take the Lead in Daily Revenue
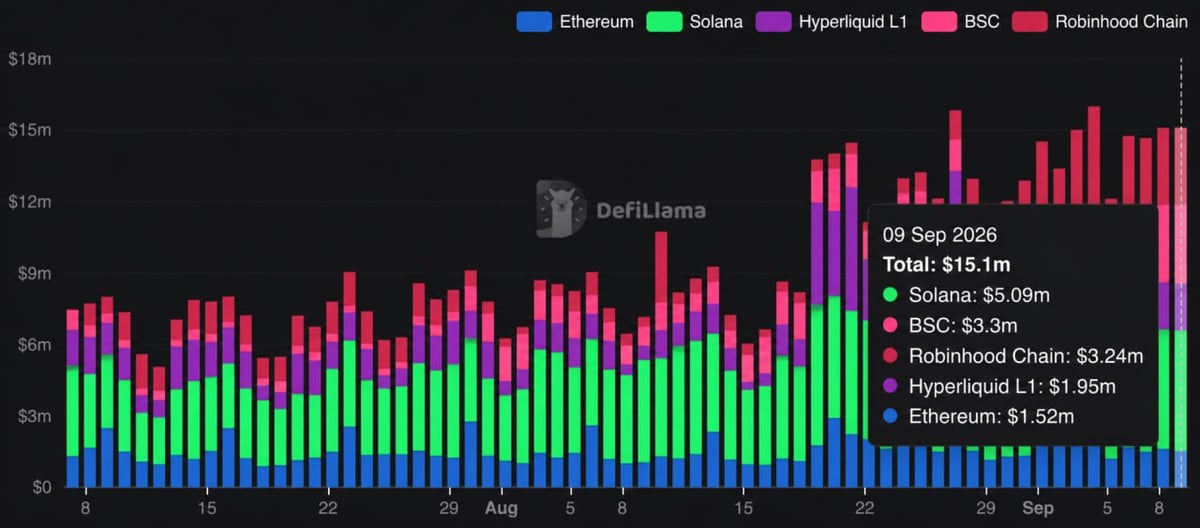
Solana's application ecosystem recorded $5.09 million in revenue over a 24-hour period, according to the data referenced in the report. The result placed Solana at the top of the tracked blockchain networks, with revenue roughly 50% higher than the next network in the ranking.
The figure focuses on revenue generated by applications operating on Solana rather than the blockchain's overall network revenue. That distinction is important because application revenue measures the money retained by protocols and applications, while network fees can also include amounts paid to validators and other parts of the underlying blockchain infrastructure.
DeFiLlama currently tracks Solana's application revenue separately from its chain fees and chain revenue, illustrating the difference between activity at the application layer and revenue generated by the underlying network.
DeFiLlama — Solana revenue rankings
What Solana's App Revenue Measures
Application revenue provides a way to measure how much economic activity individual protocols are capturing from users.
For example, Solana's tracked applications include decentralized exchanges, trading platforms, launchpads, wallets, oracle services and other onchain products. DeFiLlama's current Solana revenue dashboard lists applications such as Pump, Fomo, Axiom Pro, Pyth, Raydium, Phantom, DEX Screener and Jupiter among the network's revenue-generating protocols.
This means the $5.09 million figure should not be interpreted as $5.09 million going directly to Solana itself or to SOL holders. It represents revenue generated at the application level during the measured period.
That distinction makes the metric useful for evaluating whether users are generating economic activity through applications built on a blockchain rather than simply measuring the amount of capital locked in its protocols.
Solana's Application Economy Has Remained Strong
The latest daily figure follows a broader period of strong application-level revenue for Solana.
DeFiLlama data showed Solana applications generated $143.23 million during August 2026, representing 38.1% of the $375.53 million in application revenue tracked across blockchains during the month. Solana Compass reported that the network ranked first for the period.
August also marked a substantial increase from July, when Solana applications generated approximately $82.9 million. That represented a roughly 73% month-over-month increase and demonstrated that the network's application revenue had rebounded significantly from the previous month.
Solana Compass — August 2026 app revenue data
Trading and Consumer Apps Drive Activity
A number of different application categories contribute to Solana's revenue economy.
DeFiLlama's current revenue ranking shows Pump among the largest revenue-generating applications on Solana, followed by trading applications such as Fomo and Axiom Pro. Other contributors include infrastructure and financial applications such as Pyth, Raydium, Phantom and Jupiter.
The diversity matters because application revenue is not generated by a single type of product. Trading activity, token launches, decentralized exchanges, wallets and other services can all contribute to the amount of revenue captured by applications.
This also means daily revenue can change quickly. A 24-hour figure represents activity during a specific window and should not automatically be treated as a long-term trend.
Solana — Official ecosystem and blockchain resources
Revenue Is Different From Network Fees
One of the most important details when analyzing blockchain revenue data is the difference between fees and revenue.
Users may pay fees when interacting with applications or sending transactions, but those fees can be distributed among different participants. Depending on the protocol and blockchain, some funds may go to validators, liquidity providers, token holders, treasuries or application operators.
DeFiLlama therefore separates several measurements. Its Solana dashboard currently reports chain fees, chain revenue, app fees and app revenue as different metrics.
For readers tracking blockchain adoption, app revenue can offer a different perspective from transaction count or total value locked. It focuses more directly on the economic value applications are retaining from the activity taking place on the network.
Solana's Lead Extends Beyond a Single Day
The $5.09 million daily result is notable because it was reported at roughly 50% above the next network, but the broader monthly data also shows Solana maintaining a strong position in application revenue.
In August, Solana's $143.23 million in application revenue accounted for more than one-third of the total tracked across blockchains. Hyperliquid ranked second with approximately $55.6 million, followed by Ethereum at about $47.1 million and BNB Smart Chain at roughly $34.7 million.
That monthly performance puts the daily result into a larger context. Solana's application economy has been generating substantial revenue across multiple periods rather than relying solely on one isolated 24-hour spike.
However, daily rankings can move considerably depending on trading activity, token launches and user demand. A single day's leadership therefore does not guarantee that the same ranking will persist.
Why Solana App Revenue Matters
For the Solana ecosystem, application revenue provides one measure of the economic activity taking place above the base blockchain.
A strong figure suggests that applications are capturing meaningful fees and revenue from users, while the variety of applications generating that revenue provides insight into the network's broader ecosystem.
The latest $5.09 million figure therefore adds another data point to Solana's recent application-revenue performance. Combined with the $143.23 million recorded during August, the numbers show that Solana remains one of the leading blockchain ecosystems by application-level revenue.
At the same time, the figures should be viewed as activity measurements rather than guarantees of future performance. Application revenue can fluctuate significantly from day to day as market conditions and user behavior change.