Solana Struggles to Break Above Key Resistance
Solana (SOL) remained under pressure on Aug. 5, trading near $73.84 as buyers struggled to reclaim the important $75 resistance level. Despite holding above recent lows, the cryptocurrency has repeatedly failed to establish momentum above this price since July 30, leaving its short-term outlook uncertain.
Technical indicators suggest that while buyers continue defending support levels, sellers still have the upper hand.
Moving Averages Continue to Cap Upside
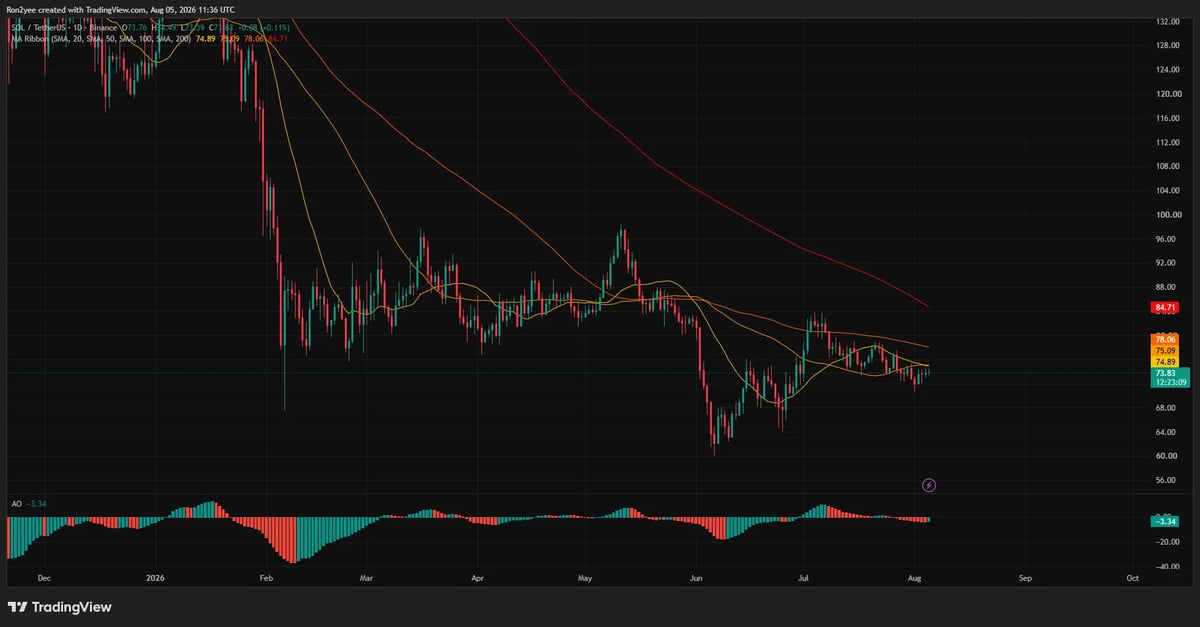
The daily chart shows Solana trading below several important moving averages that are acting as immediate resistance.
Current resistance levels include:
20-day SMA: $74.89
50-day SMA: $75.09
100-day SMA: $78.06
200-day SMA: $84.71
With all four moving averages positioned above the current market price, the broader trend continues to favor bearish sentiment.
Meanwhile, the Awesome Oscillator remains in negative territory at -3.34, while its red histogram bars indicate bearish momentum has started strengthening again after easing in late July.
Even so, SOL has successfully defended the $70.60 swing low, preventing the recent pullback from turning into a larger breakdown.
Spot Selling Raises Distribution Concerns
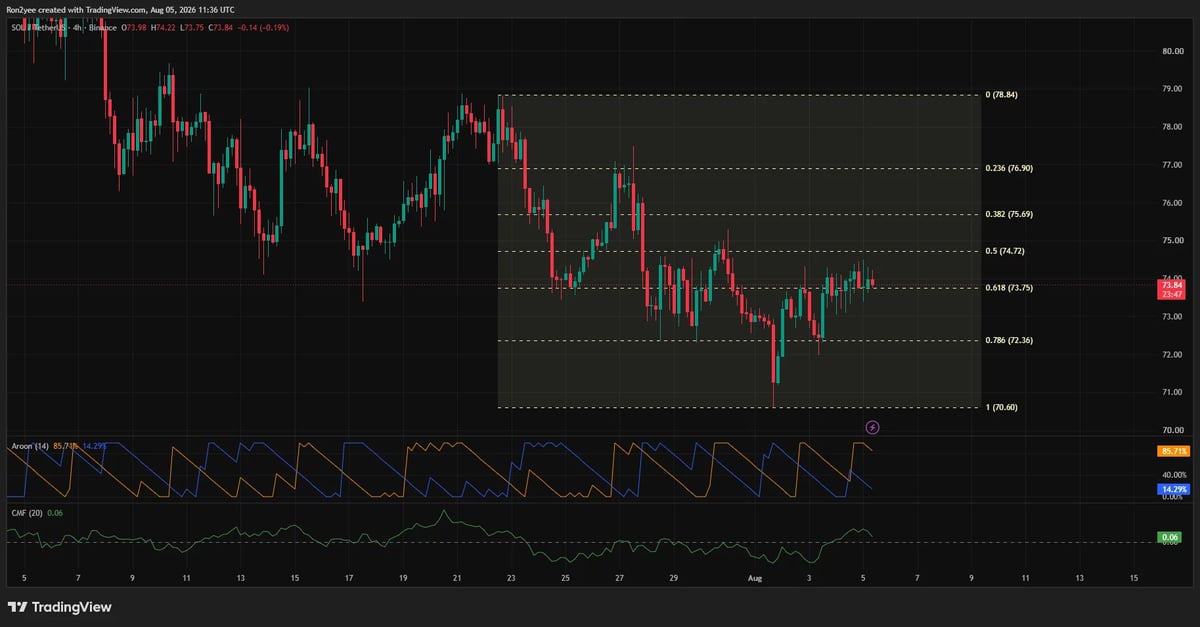
On the four-hour chart, Solana continues to consolidate around the 61.8% Fibonacci retracement level near $73.75.
Holding this level could allow buyers to challenge the 50% Fibonacci retracement at $74.72. However, market data suggests demand remains weak.
CryptoQuant contributor Ted Pillows warned that Solana's sideways movement may actually represent a distribution phase rather than healthy consolidation.
Source:
https://x.com/TedPillows/status/2084941984989663692
Distribution occurs when larger holders gradually reduce positions while prices remain relatively stable. Once buying demand weakens, this often increases the risk of a sharper decline.
Technical Indicators Show Mixed Signals
Short-term indicators present a mixed picture.
The Chaikin Money Flow (CMF) on the four-hour chart remains slightly positive at 0.06, indicating that some capital continues flowing into the asset.
However, the Aroon Indicator tells a different story:
Aroon Down: 85.71%
Aroon Up: 14.29%
This suggests recent lows have carried more strength than recent highs, indicating sellers still maintain overall control despite buyers defending support.
Related: Solana Proposal Could Increase Daily SOL Burns to $650K and Accelerate Token Deflation
Liquidation Zones Could Drive the Next Move
Leverage data shows significant liquidation clusters building on both sides of the current price.
Upside liquidity
If SOL breaks above $74.70–$75.00, short positions could begin closing, potentially fueling a move toward:
Downside risk
If Solana loses $73.75, selling pressure could accelerate toward:
A confirmed break below $70.60 would invalidate the current consolidation pattern and increase the likelihood of revisiting June's recovery zone.
While liquidation heatmaps do not predict market direction, they identify areas where leveraged positions could amplify price volatility.
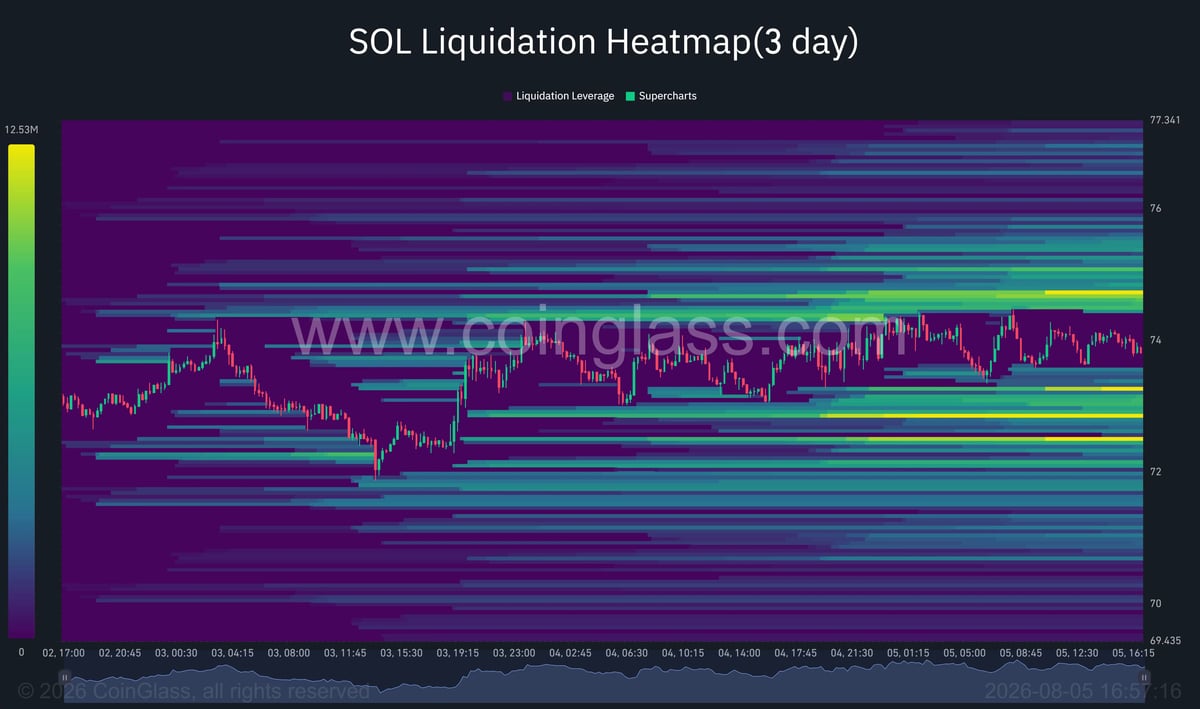
Source: CoinGlass
Analysts Say $76 Remains the Key Bullish Trigger
Crypto analyst Michaël van de Poppe believes Solana needs to reclaim $76 before a sustained recovery can begin.
According to the analyst, a breakout above this level could provide an attractive buying opportunity, with a longer-term upside target near $120.
Before reaching that objective, however, SOL would still need to overcome several resistance levels, including:
$76.90
$78.06
$78.84
$84.71 (200-day SMA)
Institutional Adoption Continues Despite Weak Price Action
Although Solana's price has remained subdued, institutional interest in the network continues to expand.
A July 31 SEC filing revealed that BlackRock plans to issue tokenized shares of its Daily Reinvestment Stablecoin Reserve Vehicle across supported public blockchains, including Solana.
The fund will invest in:
BlackRock also intends for its on-chain shares to qualify as reserve assets under the GENIUS Act, subject to regulatory approval.
Separately, governance discussions remain active within the Solana ecosystem.
The proposed SGP-0003 governance package combines SIMD-0550, which accelerates Solana's disinflation schedule, with SIMD-0553, a proposal introducing resource-based transaction fees that could increase daily SOL burns from approximately 650 SOL to as much as 9,000 SOL.
Outlook
Solana remains trapped between improving long-term fundamentals and short-term technical weakness.
A sustained move above $76 would strengthen the bullish outlook and shift attention toward higher resistance levels.
However, if sellers push the price below $72.36, the market could revisit $70.60, placing the recent recovery at risk.
Until either scenario plays out, SOL is likely to remain range-bound as traders await stronger confirmation from both technical indicators and market demand.